MTuner documentation overview
MTuner is a memory profiler and memory leak finder for Windows, PlayStation4, PlayStation3, etc.
Visit project page on GitHub
MTuner utilizes a novel approach to memory profiling and analysis, keeping entire time-based history of memory operations. Users can perform queries over this data set in order to gain a unique insight in memory related behavior of your software.
MTuner SDK provides additional functionality for memory profiling, including event markers, memory tags, named allocators and much more.
Quick demonstration of using MTuner can be seen on YouTube
Features
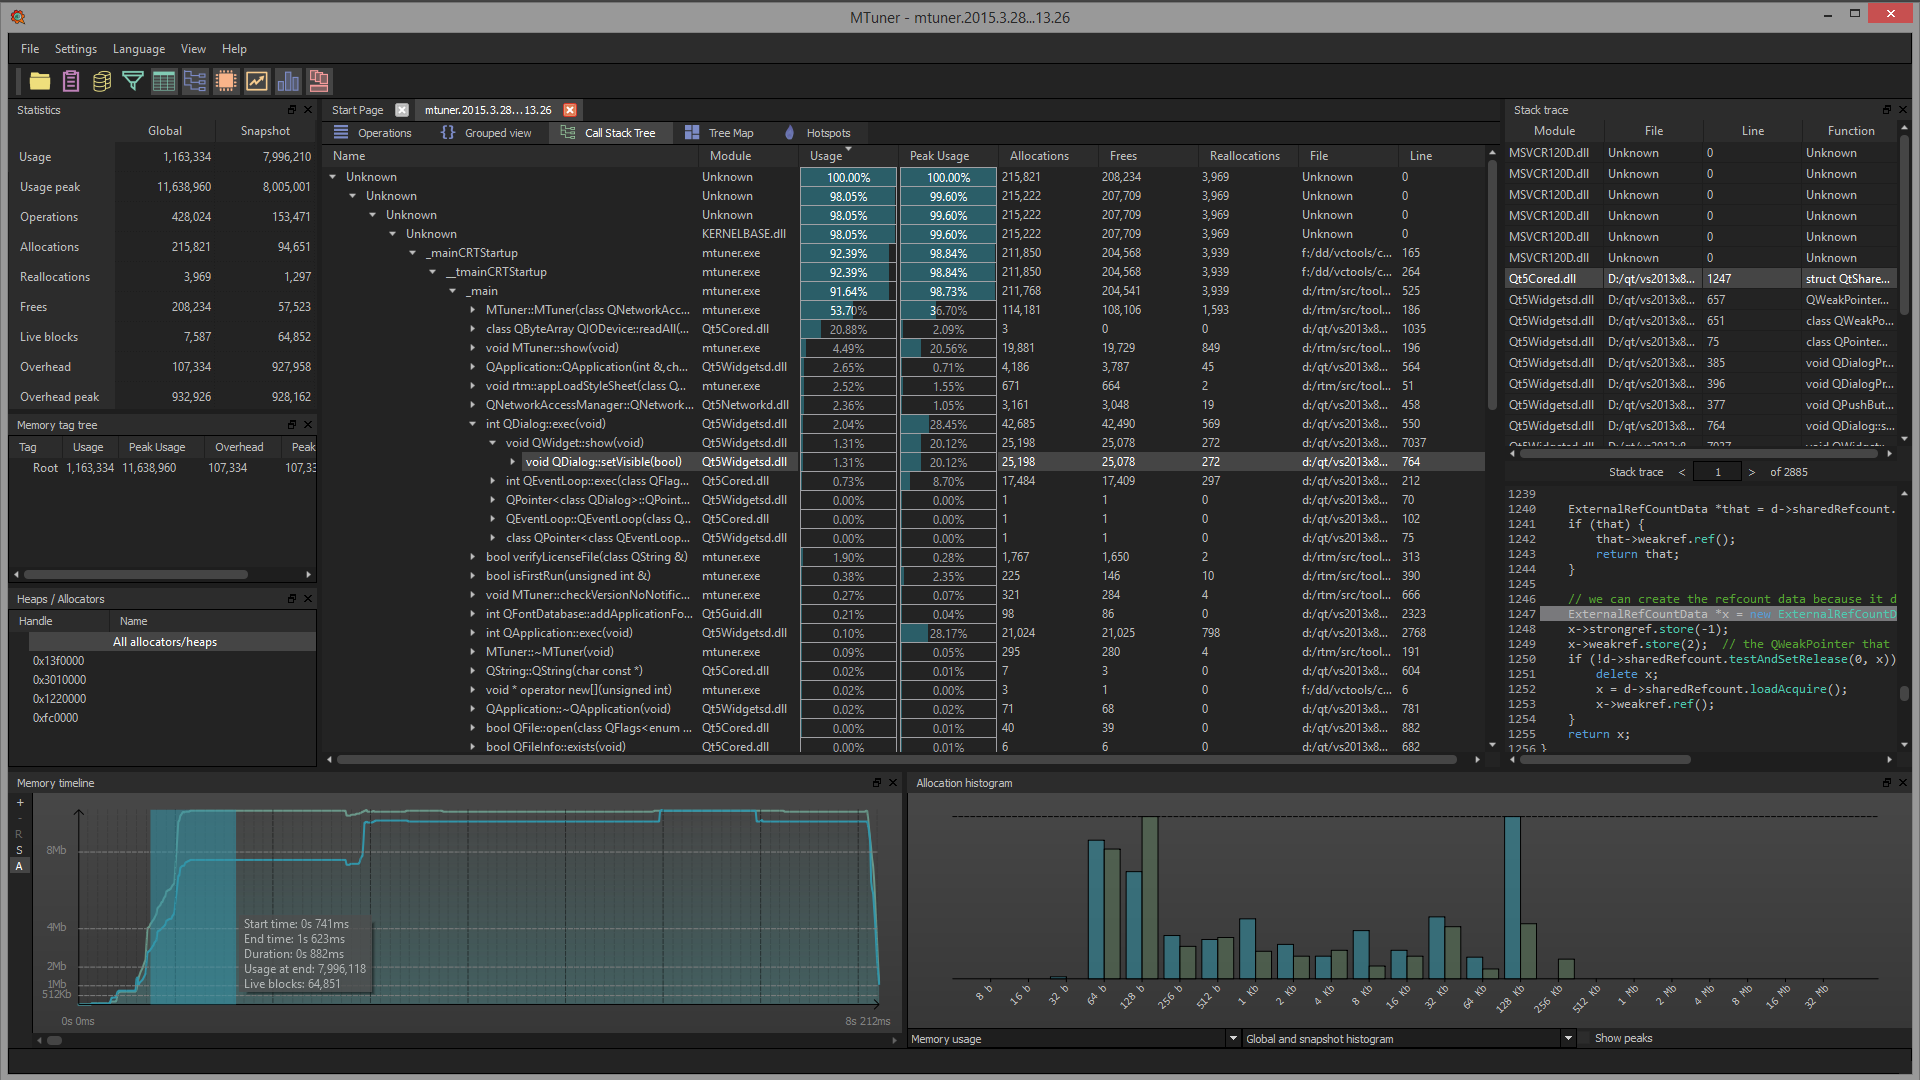
MTuner intercepts all memory operations performed by your application (allocate, reallocate, free) and stores them in capture files to be analyzed offline. Having entire history of memory operations in memory allows for powerful queries making it possible to quickly narrow down sources of memory leaks, spikes, high count of allocations, etc. Some feature highlights include the following:
High performance
Profiling applications has minimal impact on run-time performance. MTuner can handle very large number of allocations per second with linear performance scaling.Non intrusive
MTuner makes no internal memory allocations during profiling. This allows MTuner to capture all allocations, even coming from CRT init phase or global variables.Memory timeline graph
With entire history of memory operations, MTuner allows for a new way to visualize memory usage evolution in your application.Filtered views
Allocations can be filtered by time range, heap, allocation size or memory tag (or any combination of those filters). For example, it’s trivial to isolate allocations performed during data loading that are under 64 bytes in size and made through a specific allocator.MTuner SDK
For developers using a custom memory manager or developers that want to mark timed events or add custom allocation tags and much more - MTuner SDK provides complete control! It can be integrated easily in any project and supports a number of platforms.Continuous integration
MTuner can help developers track changes in memory usage on a daily basis or even after every check-in! MTuner comes with full support for command line based instrumentation and profiling.
And many more! Just download it and have a try!