Command line usage
MTuner from command line
MTuner comes with full support for command line capturing and profiling. Capturing profiles from the command line applies only to applications running natively on the host OS as manually instrumented applications produce capture files independently.
There are two actions that can be performed using MTuner from the command line: profiling and analysing captures created in previous profiling runs. Profiling will create capture files (*.MTuner) which can be analysed in consequent runs. This may be useful for nightly builds to create automated memory reports.
Windows has two extensions for running executable files – .com and .exe. If two executables with the same name exist in the same folder but one using .com and other using .exe, Windows will give preference to running the .com one if invoked from the command line by the short name. MTuner uses this trick to allow starting it with a simple MTuner command. If you wish to specify the full path to the command line executable for your continuous integration server, please make sure you point it to MTuner.com.
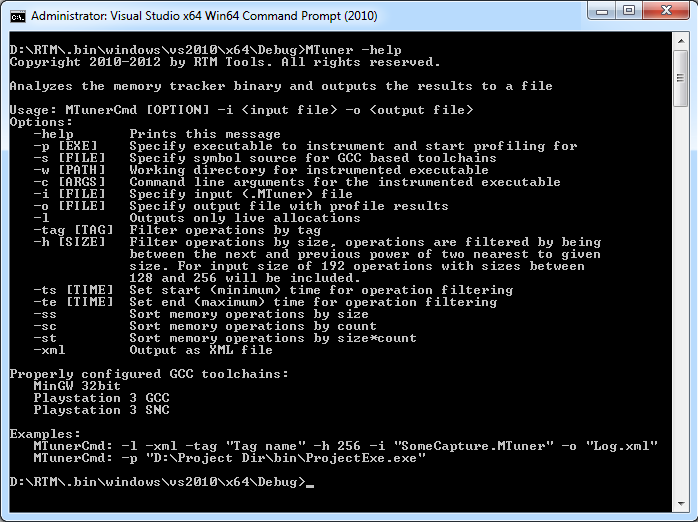
There are a number of command line switches to control the behaviour of MTuner. Some of the switches apply to the profiling mode and some of them to analysing mode. The green text in bold below the option name will indicate which one applies to what mode. Below is the list of all the switches with detailed description of their usage:
help
Prints the list of command line options along with their brief description.p [EXE]
[profile] Specify the executable file that will be instrumented and launched, creating a profile capture (*.MTuner file). The file path may be enclosed in quotes if it happens to contain spaces in it’s name.s [FILE]
[analyse] Specifies the source of symbols when analysing captures created with executables compiled with GCC toolchains. Normally this would be the executable file itself.w [PATH]
[profile] Specifies the working directory during profiling runs.c [ARGS]
[profile] String with command line arguments used to start executable for profiling.i [FILE]
[analyse] Specifies the input capture file for analysis. Normally this is a *.MTuner file created during profiling.o [FILE]
[analyse] Specifies the output file where the memory report will be created. This could either be a text of XML file if -xml options is used.l
[analyse] Only surviving/live allocations at the end of profile will be added to the memory report. This is equal to creating a memory leak report.tag [TAG]
[analyse] Specifies a tag name to be set as a filter. Using this option implicitly enables filtering. For more information on filtering please visit the filtering page.h [SIZE]
[analyse] This option is related to the histogram view from GUI mode of MTuner. The provided size will be rounded up to the nearest power of two and operations will be filtered by checking if the size is in the range between rounded up and rounded down power of two. For example, size of 192 will filter operations with size between 128 and 256 bytes. Using this option implicitly enables filtering. For more information on filtering please visit the filtering page.ts [TIME]
[analyse] Specifies the start/minimum time for operation filtering. Using this option implicitly enables filtering. For more information on filtering please visit the filtering page.te [TIME]
[analyse] Specifies the end/maximum time for operation filtering. Using this option implicitly enables filtering. For more information on filtering please visit the filtering page.ss
[analyse] If this option is used, the report will have the memory operations sorted by size.sc
[analyse] If this option is used, the report will have the memory operations sorted by count. The count is the number of times a memory operation occurs with the same call stack. This is analogous to the grouped view.st
[analyse] This options specifies sorting by the product of count and size (see previous two options for clarification).xml
[analyse] If this option is used, the output format of analysis will be XML. This is useful if additional transformations of data are needed, like XSLT to create HTML reports from continuous integration server.
