Hotspots
Hotspots view
Hotspots view, as its name implies, represents a summary of the biggest sources of memory activity in your application, per category. Each of the categories is meant to provide insight in what areas of your code base need most attention.
Currently, there are four hotspot categories. Below is the detailed description of each category:
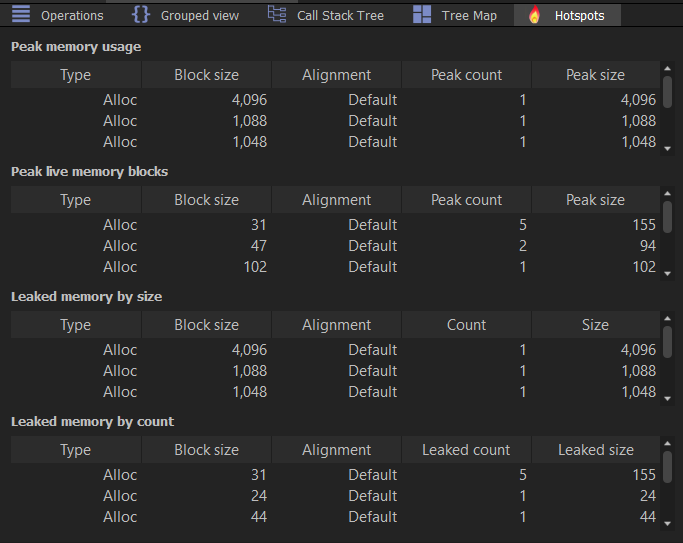
Peak memory usage
This category lists code paths that result in the highest amount of memory, in bytes. By inspecting items in this list it becomes straightforward to identify the source of biggest memory allocations or highest number of allocations. Both cases may require attention, depending on the application architecture.Peak live memory blocks
In this category we have items that represent code paths that produce the highest count of live memory blocks. Often, modifying your code to reduce memory operations in this list can help with application performance and memory fragmentation. Once again, depending on the design choices of your application, action should be taken accordingly.Leaked memory by size
This category provides the list of code paths that produce biggest amount of leaked memory. Please note that this may not necessarily represent leaked memory, specifically if the filtering mode is enabled and the list applies to the subset of the capture.Leaked memory by count
While similar to the previous category, this one lists the sources of highest number of unreleased memory blocks. Normally, this would indicate a serious bug in your application. Again, keep in mind that if filtering is enabled this information applies only to a subset of memory operations.
If filtering is enabled, the hotspots view will be rebuilt to represent only the filtered operations.