Tree map
Tree map view
The tree map view is a highly visual way to look for big sources of memory activity in your application. Each rectangle corresponds to a code path and will, if space allows, show the amount of memory in the upper left corner. Clicking on a rectangle will display the stack trace in the Stack trace and source view for detailed inspection.
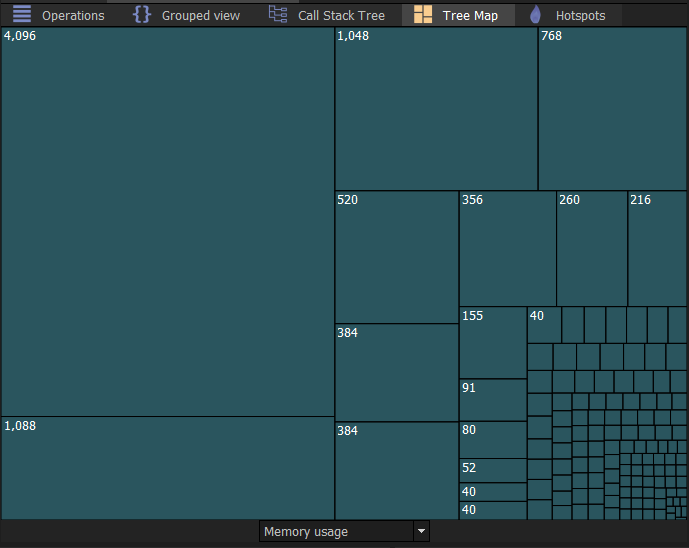
Currently, there are four different visualisations in the tree map, which can be selected using the combo box at the bottom:
Memory usage
Representation of the unreleased memory, in bytes, tree map.Memory usage peak
Peak memory usage, in bytes.Allocation overhead
Overhead of memory allocations, in bytes.Allocation overhead peak
Peak allocation overhead, in bytes.
If filtering is enabled, the tree map will be rebuilt to represent only the filtered operations.