Histogram view
Memory histogram view
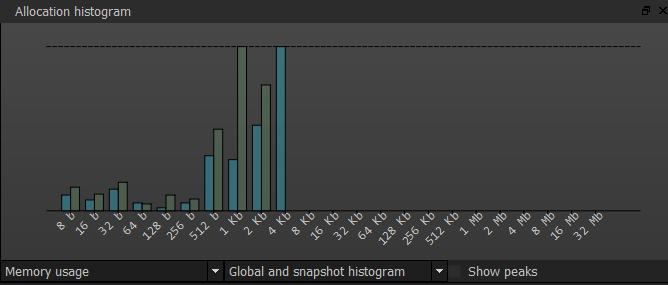
The histogram view is a breakdown of memory operations by size. Each memory operation will be placed in a bin, depending on it’s size, and each histogram bar represents a relative value depending on the current histogram view mode.

Using the combo boxes below the histogram, user can change what data is displayed. Below are the values for the first combo box (the one on the left):
Memory usage
This mode represents the memory usage at the end of the time slice determined by the second combo box.Allocation overhead
In this mode the histogram bars represent the overhead of allocations that belong to each of the bins.Number of allocations
Total number of allocations, per bin.
The second combo box determines what if the histogram displays the global (entire), snapshot (memory timeline selection) or both time slices. Additionally, the “Show peaks” check box can be toggled to display peak values for each bin alongside the current values.
Clicking on one of the histogram bars will make it selected, for the purpose of filtering. Clicking it again will deselect it. For more information about filtering please visit the filtering page.