Memory timeline
Memory usage timeline
The memory usage timeline is a view of memory usage over execution time of the application. The graph shows how the memory usage is changing over time but also serves a purpose of a powerful navigation interface.
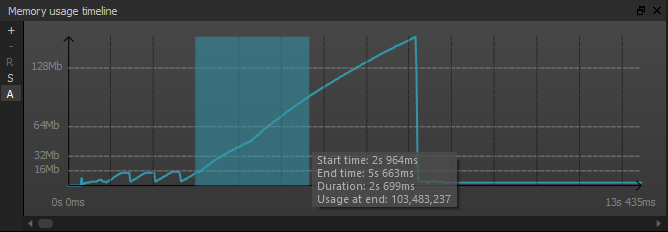
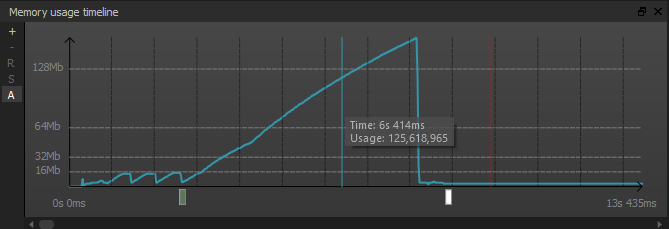
Once the capture file is loaded, the timeline will default to display entire execution time. The graph can be zoomed in and out, panned and used to select slices of time. Moving the mouse cursor will show the time and usage at the current position in graph.

Below is the overview of all possible navigation options:
Zoom in
The graph can be zoomed in using either mouse wheel (up) or the ‘+’ button on the left side of the timeline.Zoom out
Zooming out is performed using mouse wheel (down) or the ‘-‘ button.Reset zoom
Resetting the zoom means returning to default, global, view. This action can be performed using the ‘R’ button or a context menu activated with right mouse click.Selecting a time slice
Users can select a slice of the time by using the left mouse button – click, drag and release to select a range. During the selection, additional information will be displayed in the tooltip.Zoom to selection
Zooming to selection can be performed using ‘S’ button or the context menu.Pan
Once zoomed in, the graph can be panned left or right using the right mouse button or the scroll bar below the graph.
Regardless of the state of the graph, the visible portion always has a minimum and maximum usage values. MTuner will scale the graph automatically to display that range across the entire vertical axis. This allows very detailed view in case of very long captures or captures with high variations of memory usage. It is the default behaviour of the graph but it can be toggled using the ‘A’ button on the left side of the graph.
In addition, if the capture was done using the Instrumentation API and timed events were added – markers will appear below the graph that can be used for high precision time range selections (see image below). For more information on markers visit the Instrumentation API section. Right clicking the markers will invoke the context menu allowing to set marker as a start/end of the time slice selection. Existing selection can be snapped to a marker using the same context menu.
